Monitor Terraform Cloud workspaces needing attention with Grafana
With several engineers and many Terraform Cloud workspaces, sprinkled with run triggers, it’s easy to overlook plans awaiting confirmation or forget about failed runs. While you can configure Slack notifications for failed runs, it quickly becomes noisy, raising alarm even if the problem is immediately mitigated.
I find it a lot more useful to get alerts only for workspaces that are left unattended for “a while”. With Terraform Cloud Exporter and Grafana we can get a nice overview panel of workspaces needing attention, and alerts if they are left alone.
Terraform Cloud exporter
While 
I’ve deployed the container on Kubernetes, mounting a Terraform Cloud “team” token (read-only access will suffice) as the TF_API_TOKEN environmental variable.
I found that the endpoint typically takes ~10 seconds to produce metrics. We were getting a lot of “No data”, which I suspected was due to scrape time out. Bumping the scrape time-out to 30 seconds seemed to solve the problem.
If you’re using PodMonitors, you might configure your podMetricsEndpoints something like this:
spec:
  podMetricsEndpoints:
    - interval: 5m
      path: /metrics
      port: metrics
      scrapeTimeout: 30s # default of 10 seconds seems insufficient
Grafana
Dashboard
While the included overview dashboard showcases nicely the metrics exported, I was missing a simple table panel showing the workspaces needing attention, to put on our monitoring TV screen. I created the following query:
max(
tf_workspaces_info{current_run_status=~"errored"} * 0 + 2
or
tf_workspaces_info{current_run_status=~"cost_estimated|planned|policy_checked|policy_override|post_plan_completed|pre_apply_completed"} * 0 + 1
or
tf_workspaces_info{current_run_status!~"cost_estimated|planned|policy_checked|policy_override|post_plan_completed|pre_apply_completed|errored"} * 0
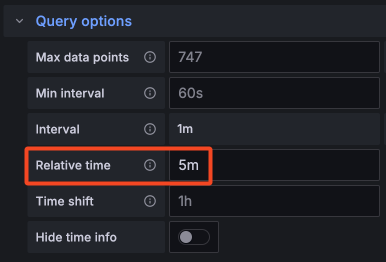
) by (name, current_run_status, current_run_created_at) > 0By manually setting the metric value based on status (2 for errors, 1 for awaiting user action) and using the max() function, the worst state each workspace has been in the current time range is shown. I’m actually not sure if that’s a given when using table panels, but I explicitly set the panel to only query the last 5 minutes:
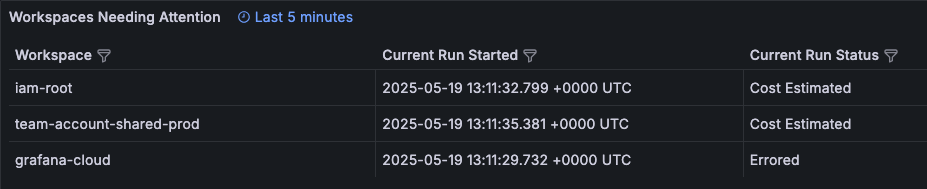
This gives me a nice table like this:
Alerts
For the alerts I’m using almost the exact same query, with two important changes:
- Group by (workspace)
nameonly - To create a single alert instances per workspace with current status, rather than new instances per combination of name, status and run time. - Remove the
> 0filter - Otherwise alert instances would be created for workspaces needing attention, but filtered out when resolved, thus never clearing the alert
The alert query looks like this:
max(
    tf_workspaces_info{current_run_status=~"errored"} * 0 + 2
    or
    tf_workspaces_info{current_run_status=~"cost_estimated|planned|policy_checked|policy_override|post_plan_completed|pre_apply_completed"} * 0 + 1
    or
    tf_workspaces_info{current_run_status!~"cost_estimated|planned|policy_checked|policy_override|post_plan_completed|pre_apply_completed|errored"} * 0
) by (name)
If Terraform Cloud Exporter was updated to also expose workspace project names in the metrics, you could customise alert routing in a multi-tenant Terraform Cloud setup, to direct notifications to the appropriate teams.